The eCommerce Customer Lifecycle
How To Grow eCommerce
Explore the chapters:
|
Chapter 6 – Analytics
So why did we save Analytics for last? It’s because this topic is a bit different than the other stages of the ECL. When it comes to building an eCommerce business, Analytics is not a standalone stage but rather an ongoing process. There is no ultimate solution or end goal when it comes to analytics. Instead, analytics serves as an auxiliary resource to track your growth. Analytics can aid in the continuous process of growth, change, assessment, revisions, trials, assessment… and on and on.
Analytics acts as the backbone that keeps all of the other stages working. Moving forward. Progressing. Subconsciously and consciously motivating growth. On course to drive you toward your end goals.
The value in data and analytics is that it tells you without uncertainty what initiatives are working and which ones are failing. This feedback allows you to adjust your business strategies and improve the other stages of your growth story.
So let’s dive in and explore how you can use analytics in each stage of the ECL.
Introduction to Analytics Tools
For those exploring tools to aid in your analytics and reporting, the first resource to come to mind is usually Google Analytics, but for good reason. Google Analytics provides free, fast, and simple set up services that offer a solid foundation of data to work from.
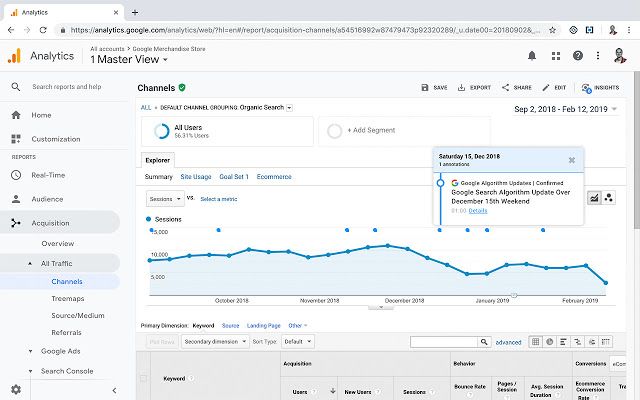
Behavior Reports will show you data such as top search terms visitors by landing page, and visitors by device. App integrations like Nextopia or Algolia provide more advanced search term analytics as well.
A website cart analysis will also show you correlations between products that were added to the cart within a specified time period, which can help inform product bundles or discounts.
Analytics for Acquisition
When you’re focused on acquiring more shoppers and customers, you’re most likely attempting a bunch of different strategies to spread awareness and draw people to your shop. But, how do you know which strategies are working and which aren’t?
Yep, you are correct: Analytics.
Acquisition campaigns take many forms and are spread across various channels. Content marketing, paid advertising, SEO optimization or other strategies are the most common methods to improve acquisition rates.
The biggest question to ask when it comes to effective acquisition is: Which campaigns and channels are most effective?
To answer this, we’re gonna break it down into two pieces:
- What is your actual spend per channel?
- What are your sales per channel?
Spend Per Channel
Imagine for example that you decided to focus on SEO to boost your customer acquisition. You hire an SEO consultant to help you refine your keywords strategy and develop better long tail keywords to effectively target the right kinds of shoppers for your store. How do you know whether the results of your SEO campaign are worth the costs of the consultant’s fees?
First, you’ll want to look at how much the SEO campaign costs. These costs may go beyond the flat fee for your SEO consultant so it is important to look at other factors.
To understand the actual spend per channel, it’s important to consider all relevant costs, including:
- Staff time and salaries
- Paid time (retainers, consultant fees, etc.)
- Actual costs for paid media (advertising, etc.)
Sales Per Channel
Once you identify the complete spend per channel for all of the channels you’re using to increase acquisitions, an analytics tool like Google Analytics, Shopify Analytics, Glew or Zaius can help you track sales associated with each channel.
Nevertheless: Sales attribution can be tricky. There’s no one agreed-upon method to attributing a sale to a single initiation point. Some people claim a sale should be attributed to the first touchpoint (such as an ad), others say it’s the last or most recent touchpoint, while others say it should be evenly weighted across channels. There are literally dozens of theories on how to handle sales attribution, which can make it complicated to decipher data.
The best suggestion I can give you is: pick one and stick with it. Be consistent. It’s the best you can do. Do not cherry-pick or contort the data to fit your goals or predictions, but maintain a level of consistency to yield the best results. All data caries a relative level of value and it will help you make more informed decisions moving forward.
UTM Codes for Clearer Sales Attribution
UTM (Urchin Tracking Module) codes can be used to track sales attribution for certain sources. UTM codes can be added to the end of any URL using a question mark to append a source, campaign name, etc. to help identify where a shopper came from – like the below example from Hubspot (the UTM code is highlighted in orange):
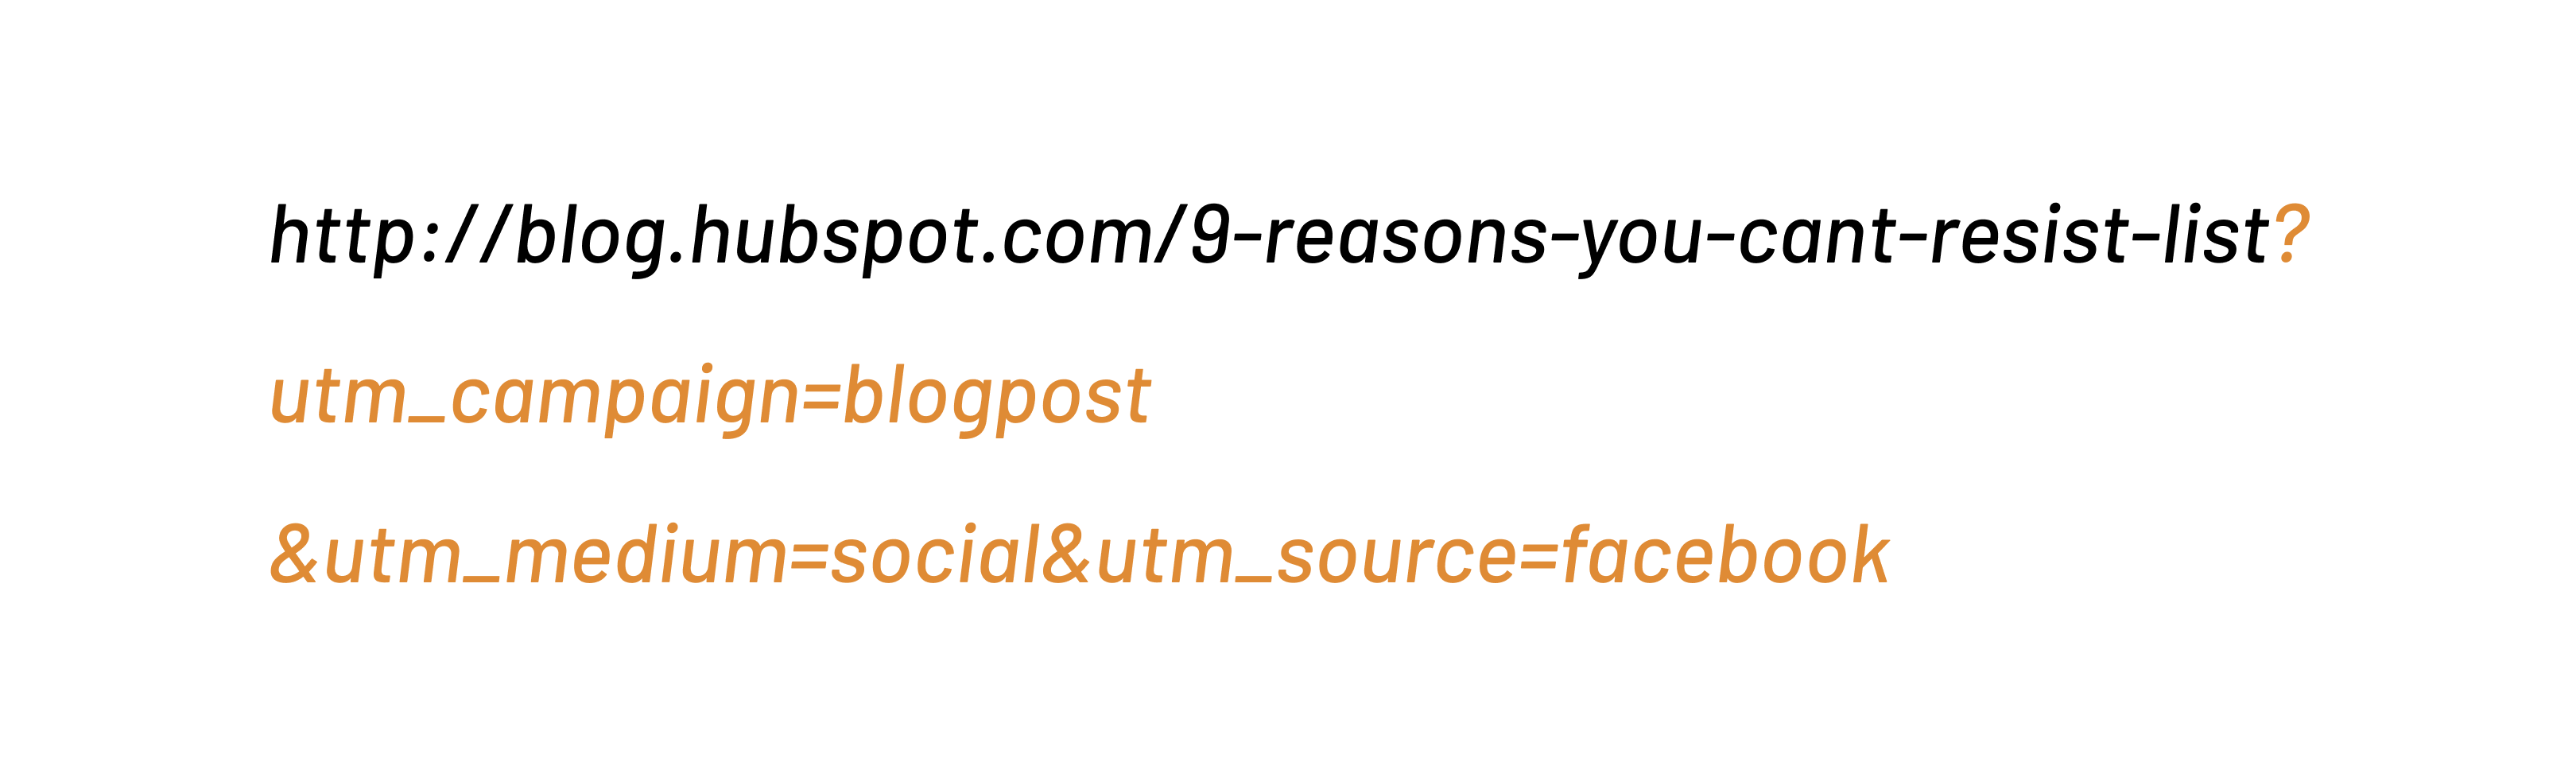
This enables Google Analytics to tell you where searchers came from – for both online and offline campaigns – and what campaign directed them to you. UTM codes facilitate the gathering of data on traffic and conversations for social campaigns, print ads, coupons, radio ads, TV commercials, etc. without creating custom landing pages for each campaign.
Analytics for Conversion
Conversion is all about on-site behavior. Understanding how shoppers are using and interacting with your site is another critical function for a good analytics tool. Their experiences will directly influence conversion rates.
Traditional site analytics tools like Google Analytics are good for providing a macro-level view of conversions. Here are some pertinent criteria to consider:
- Most popular content
- Where people are clicking
- How much time shoppers spend on your site
- Bounce rate
- Number of unique visitors
- Number of unique sessions
This data will give you a broad, informed understanding of how people are generally using your site.
Other tools like Hotjar and Inspectlet exist that you can use to gain a more micro-level view into your conversation analytics. These tools provide customer behavior analysis, profile individual users, and can screen record individual user sessions. Some will even illustrate scroll and click behavior using a heat map, like this from Hotjar:
These tools let you dig deeper into how conversions happen on your site: what’s working and where the opportunities are to improve. Although it’s time-prohibitive to consume massive amounts of this type of data, it can be incredibly valuable for gaining a real understanding of on-site behaviors and trends.
Analytics for Fulfillment
From an outside view, fulfillment can seem relatively straight-forward. You may be wondering how much analytics can actually help. But, we’ve realized that most business owners significantly underestimate their fulfillment costs. The risk of underestimating fulfillment costs is over-assuming total profits.
Many merchants consider fulfillment to be as simple as basic shipping costs. However, there are a lot of other costs to consider in the big picture – everything it takes to get a product from you to your buyer.

Fulfillment costs also include:
- Packaging
- Handling
- Taxes
- Customs Fees
- Returns
- Inventory Storage and Management
App integrations like Avalara, ShipStation, and ShipperHQ offer fulfillment analytics that can help you configure and price shipping properly, taking into consideration a complete (and complex) picture of fulfillment costs.
Analytics for Retention
Retention often comes down to how well you understand your customers. Analytics data is key to developing a deep and nuanced view of your customers, their shopping behaviors, and what motivates them.
Some of the key metrics to growing retention are:
- Customers’ spend
- How much time they spend on your site
- How often they make a purchase
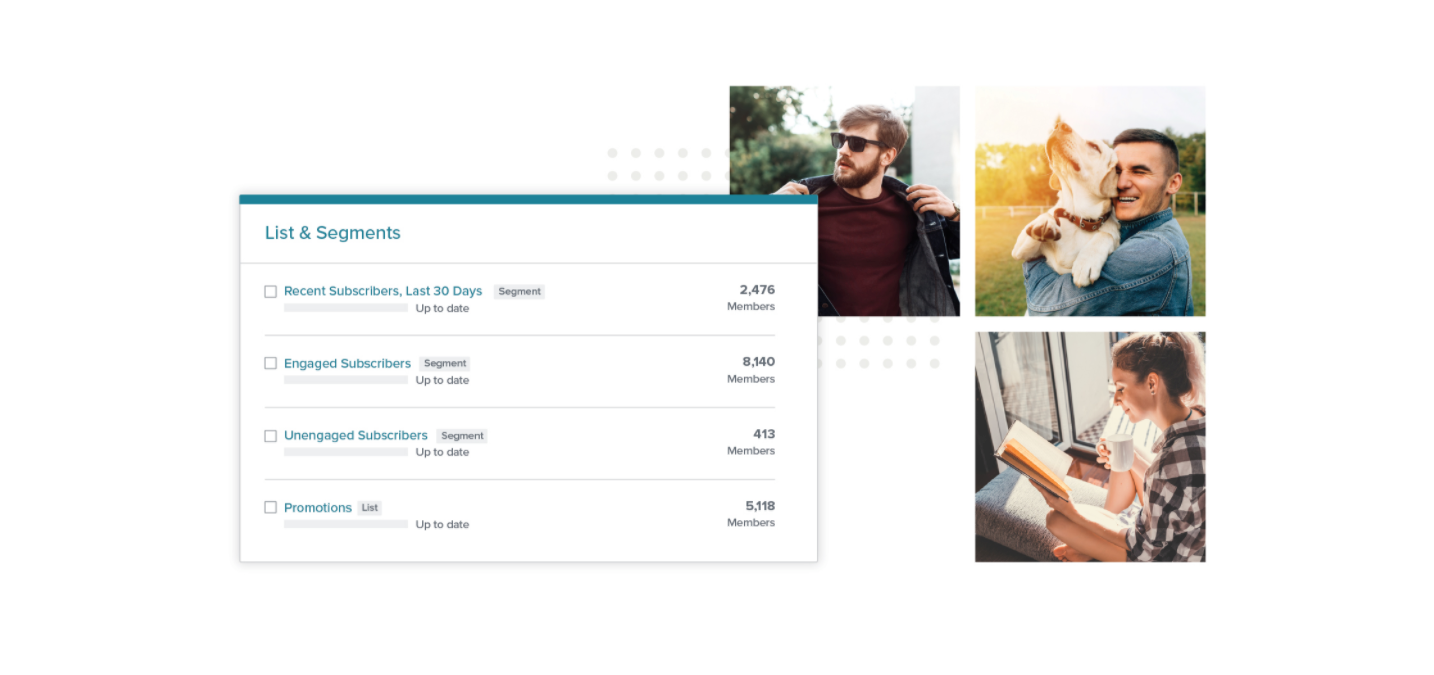
Data to Create Customer Segmentation
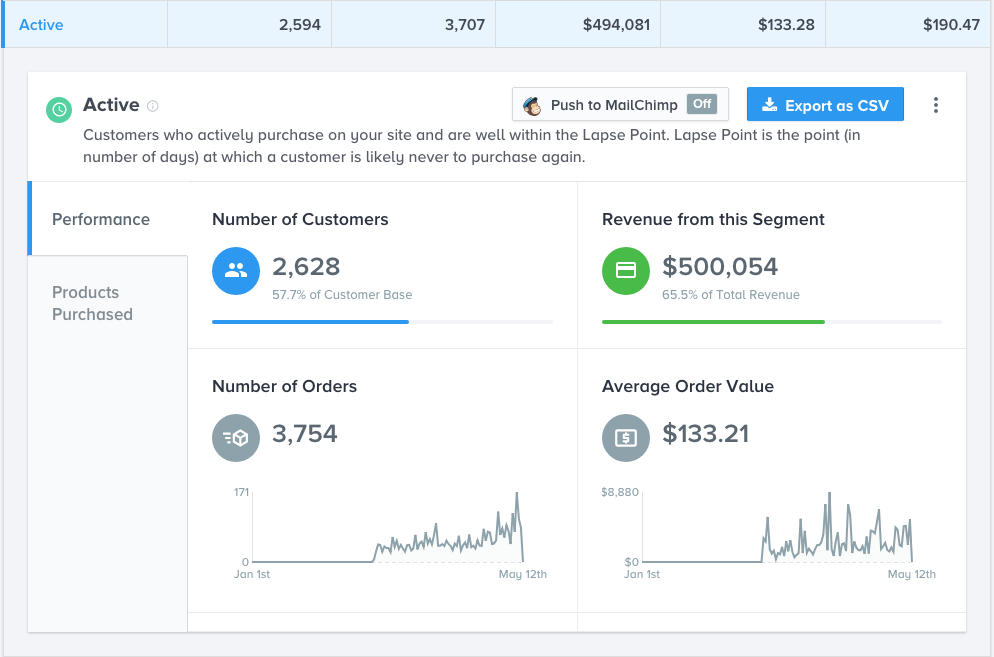
Customer segmentation (like this example from Glew) can give you insight into what kinds of shoppers you have: Are they discount driven or value-driven? Excited by exclusives or motivated by what’s popular?
Answering these questions will give you the information you need to develop personalized messaging or push marketing campaigns to highly targeted audiences.
Glew and Zaius are great tools to help you segment your customers. (Other tools like Klaviyo, Salesforce, or other marketing automation or CRM tools can provide insight here as well.) Use them to create customer profiles: individual profiles or macro-level profiles that group customers based on their buying habits.
A Global View of All Your Business Analytics
To make the data easier to use (and wrap your head around), identify the few key metrics that will help you assess how you’re doing in the moment and over time. While those metrics may be different for every business, they may include:
- Average customer acquisition cost
- Average order size
- Return rate
- Order margin
- Number of orders per customer
Once you have identified what your company’s key metrics are, consolidate them together into a single dashboard using a business intelligence tool or KPI dashboard.
Tools can make it easy to pull together data from across various data sources and aggregate them into a global business view, giving you accountability across all of your metrics.
The most important thing to keep in mind when it comes to analytics and data is that data is not helpful; information is helpful. Data without insight is just a bunch of numbers; it doesn’t mean anything for your business if you can’t turn it into value.
Well, that’s all folks. Thanks for reading the Trellis guide to the eCommerce Customer Lifecycle. be sure to reach out with any questions or for more information on any of the stages discussed. We have a team of experts waiting to assist you. Let’s grow together as your journey begins now! Good Luck!
Explore the chapters:
|